
Page 3 - CII_South-India-2020
P. 3
9
State of the Economy
Exports
$14.9 bn
(2018 - 2019) GSDP
$125.6 bn
Per Capita Income Current price (2017 - 18)
$2233
Ease of Doing Business*
FDI Inflow Rank 1
$3.45 bn *State Business Reform Action Plan 2019 (BARP)
(2018 - 2019)
Source:
• Department for Promotion of Industry and Internal Trade (DPIIT)
• Department of Administrative Reforms & Public Grievances
• Center for Good Governance
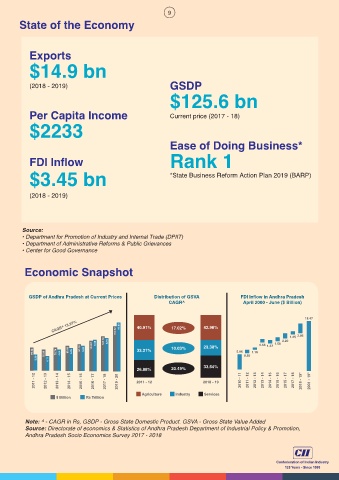
Economic Snapshot
GSDP of Andhra Pradesh at Current Prices Distribution of GSVA FDI Inflow in Andhra Pradesh
CAGR^ April 2000 - June ($ Billion)
18.47
CAGR^ 13.97% 154.62 10.80 40.91% 17.02% 42.98% 1.25 2.86
79.12 75.56 76.74 4.64 85.58 5.25 91.70 6.04 103.67 6.98 124.79 8.10 32.21% 10.03% 23.38% 5.96 1.16 0.68 1.37 1.56 2.20
3.39 4.11 0.85
33.64%
26.88% 20.49%
2011 - 12 2012 - 13 2013 - 14 2014 - 15 2015 - 16 2016 - 17 2017 - 18 2019 - 20 2011 - 12 2018 - 19 2010 - 11 2011 - 12 2012 - 13 2013 - 14 2014 - 15 2015 - 16 2015 - 17 2017 - 18 2018 - 19* 2001 - 19*
Agriculture Industry Services
$ Billion Rs Trillion
Note: ^ - CAGR in Rs, GSDP - Gross State Domestic Product. GSVA - Gross State Value Added
Source: Directorate of economics & Statistics of Andhra Pradesh Department of Industrial Policy & Promotion,
Andhra Pradesh Socio Economics Survey 2017 - 2018