
Page 3 - CII_Tamilnadu-2020
P. 3
65
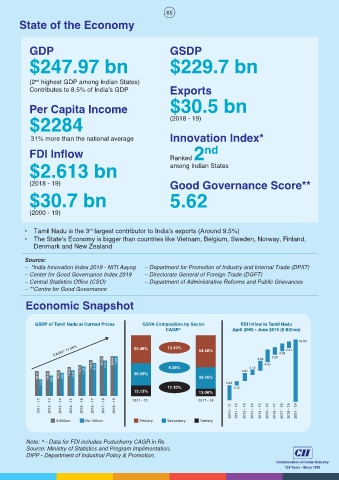
State of the Economy
GDP GSDP
$247.97 bn $229.7 bn
nd
(2 highest GDP among Indian States)
Contributes to 8.5% of India’s GDP Exports
Per Capita Income $30.5 bn
$2284 (2018 - 19)
31% more than the national average Innovation Index*
FDI Inflow Ranked 2 nd
$2.613 bn among Indian States
(2018 - 19) Good Governance Score**
$30.7 bn 5.62
(2000 - 19)
• Tamil Nadu is the 3 largest contributor to India's exports (Around 9.5%)
rd
• The State’s Economy is bigger than countries like Vietnam, Belgium, Sweden, Norway, Finland,
Denmark and New Zealand
Source:
– *India Innovation Index 2019 - NITI Aayog – Department for Promotion of Industry and Internal Trade (DPIIT)
– Center for Good Governance Index 2019 – Directorate General of Foreign Trade (DGFT)
– Central Statistics Office (CSO) – Department of Administrative Reforms and Public Grievances
– **Centre for Good Governance
Economic Snapshot
GSDP of Tamil Nadu at Current Prices GSVA Composition by Sector FDI Inflow in Tamil Nadu
CAGR^ April 2000 - June 2019 ($ Billion)
30.69
CAGR^ 11.46% 50.48% 12.40% 54.48% 2.22 3.48 2.61
189.37 12.79 221.42 14.27 222.58 16.06 9.38% 2.12 3.82 4.53
156.72 156.99 8.55 160.09 9.69 175.42 11.37 179.73 11.37 36.39% 32.46% 2.81
7.51 6.85
11.10% 1.42
13.13% 13.06%
2011 - 12 2012 - 13 2013 - 14 2014 - 15 2015 - 16 2016 - 17 2017 - 18 2018 - 19 2011 - 12 2017 - 18 2010 - 11 2011 - 12 2012 - 13 2013 - 14 2014 - 15 2015 - 16 2016 - 17 2017 - 18 2018 - 19 2001 - 19
$ Billion Rs Trillion Primary Secondary Tertiary
Note: ^ - Data for FDI includes Puducherry CAGR in Rs
Source: Ministry of Statistics and Program Implimentation,
DIPP - Department of Industrial Policy & Promotion.