
Page 3 - CII_Telangana-2020
P. 3
81
State of the Economy
GDP GSDP
$118.9 bn $121.4 bn
Ease of Doing Business
Per Capita Income nd
$2696 Ranked 2
amongst Indian States
FDI Inflow Innovation Index*
$18.98 bn Ranked 4 th
amongst Indian States
(2000 - 19)
Good Governance Score
4.83
Source:
– * India Innovation Index 2019 – NITI Aayog
– Department for Promotion of Industry and Internal Trade (DPIIT)
– Center for Good Governance
– Directorate General of Foreign Trade (DGFT)
– Central Statistics Office (CSO)
– Department of Administrative Reforms and Public Grievances
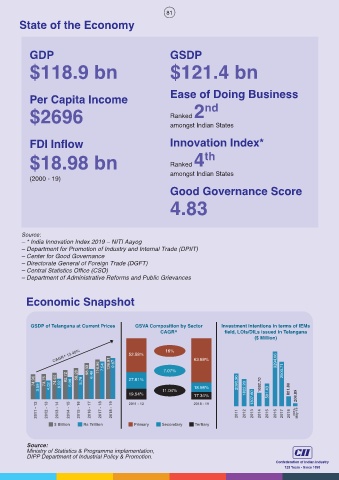
Economic Snapshot
GSDP of Telangana at Current Prices GSVA Composition by Sector Investment intentions in terms of IEMs
CAGR^ field, LOIs/DILs issued in Telangana
($ Million)
CAGR^ 13.40% 52.58% 16% 63.68% 3294.06
98.33 116.96 7.54 126.81 9.67 7.07% 2503.71
74.96 73.75 74.64 8.52 82.72 5.06 58.28 5.78 6.40 27.61% 2090.90
3.59 4.02 11.04% 18.98% 1822.20 1032.70 801.80
19.54% 591.43
17.34% 1307.60 208.89
2011 - 12 2012 - 13 2013 - 14 2014 - 15 2015 - 16 2016 - 17 2017 - 18 2018 - 19 2011 - 12 2018 - 19 2011 2012 2013 2014 2015 2016 2017 2018 2019- May-19
$ Billion Rs Trillion Primary Secondary Tertiary
Source:
Ministry of Statistics & Programme implementation,
DIPP Department of Industrial Policy & Promotion.